
The three sales team KPIs every manager should own right now are pipeline coverage, meetings booked, and win rate. These form the essential core for early-stage teams according to leading research; once these are defined and healthy, metrics like sales velocity, average deal size, and quota attainment can be layered in as the team grows. Check your CRM this week and confirm that each has a clear, agreed definition and clean underlying data before you do anything else.
According to Ebsta and Pavilion’s 2025 GTM Benchmarks, many B2B sellers missed quota in H1 2025. That figure is not a reason to panic. It is a reason to be precise about which numbers you track and what you do with them.

Here is the priority KPI set, split by who owns it:
Rep-level (daily and weekly coaching)
- Meetings booked
- Qualified sales conversations
- Lead response time
- Pipeline additions
Manager-level (weekly and monthly review)
- Pipeline coverage
- Win rate
- Sales cycle length
- Average deal size
Ops and leadership (monthly and quarterly)
- Sales velocity
- Quota attainment
- Forecast accuracy
- Customer acquisition cost (CAC)
Your immediate action: open your CRM dashboard today and check whether pipeline coverage, meetings booked, and win rate have agreed definitions, consistent data entry, and a named owner. If any of those three are missing a definition or have patchy data, fix that before adding any new metrics.
Table of Contents
- What is a sales KPI, and how does it differ from a metric?
- Why the right KPIs make or break your sales team
- The essential sales performance metrics: formulas, owners, and benchmarks
- How to choose which KPIs your team should actually track
- The three KPIs early-stage teams should prioritise first
- How to set realistic targets and benchmarks for your team
- How to track and report KPIs: tools, dashboards, and data hygiene
- Five pitfalls that undermine KPI programmes and how to fix them
- Key takeaways
- The KPI conversation most managers are not having
- How Aheadofsales helps UK sales teams improve their KPIs
- Useful sources and further reading
What is a sales KPI, and how does it differ from a metric?
A sales KPI (key performance indicator) is a specific, measurable value tied directly to a business objective. It tells you whether you are on track to hit a goal. A general metric, by contrast, is simply a number you can measure. Not every metric deserves to be a KPI, and confusing the two is where most dashboards go wrong.

Vanity numbers are the worst offenders. Total calls made, emails sent, and social media impressions can all look impressive in a weekly report while hiding a collapsing pipeline. A KPI earns its place by answering a specific business question and prompting a specific action when it moves in the wrong direction.
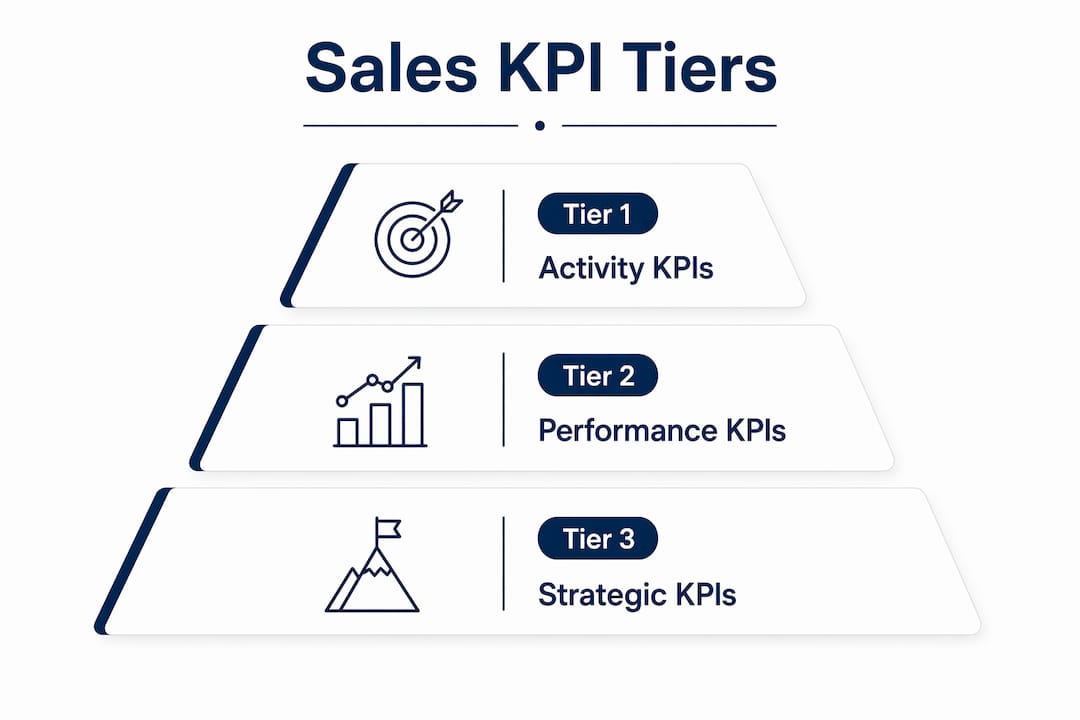
Gartner recommends organising sales performance indicators into tiers, which is the most practical way to manage cadence and coaching focus:
- Tier 1: Activity indicators (leading). These are the behaviours that predict future outcomes. Examples: meetings booked, lead response time, pipeline additions. Review weekly, act immediately.
- Tier 2: Performance indicators (lagging). These confirm whether the activity is converting. Examples: win rate, average deal size, quota attainment. Review monthly to validate trends.
- Tier 3: Strategic indicators (board-level). These measure the health of the business model. Examples: CAC, LTV:CAC ratio, ramp time. Review quarterly with leadership.
The tier model matters because it sets the right cadence. Coaching on a lagging indicator after the quarter closes is too late. Coaching on a leading indicator mid-week, when there is still time to change behaviour, is where the real improvement happens.
Why the right KPIs make or break your sales team
Picking the wrong KPIs does not just waste time. It actively damages performance by pointing your team’s effort in the wrong direction.
The primary benefits of disciplined KPI selection are:
- Goal alignment. Every rep knows what “good” looks like and why it matters to the business.
- Coaching focus. Managers can direct conversations to the specific behaviours that move the needle, rather than reviewing numbers that have already settled.
- Earlier course correction. Leading indicators give you a two-to-four-week warning before a pipeline shortfall shows up in revenue.
- Forecasting accuracy. Clean, consistently defined KPIs produce forecasts the board can trust.
- Clear board communication. Strategic KPIs translate sales activity into language that finance and leadership understand.
Two cautions worth keeping front of mind. First, metric overload: tracking more than seven KPIs at team level splits focus and reduces the quality of every review conversation. Second, unclear definitions: if two managers calculate win rate differently (closed-won vs. total opportunities vs. qualified opportunities), the number is meaningless for comparison or coaching.
The perverse-incentive risk is real. A team measured on call volume will make more calls. A team measured on qualified conversations will have better ones. Choose the metric that reflects the outcome you actually want, not the one that is easiest to count.
The essential sales performance metrics: formulas, owners, and benchmarks
The table below covers the core KPIs grouped by category. Use it as your master reference when building or auditing a dashboard.
Activity KPIs (tier 1, leading)
| KPI | Business question | Formula | Owner | When to use | Typical target | How to improve |
|---|---|---|---|---|---|---|
| Meetings booked | Are reps generating enough pipeline opportunities? | Meetings scheduled ÷ outreach attempts | SDR / BDR | Always; critical for early-stage teams | Varies by market; track trend vs. baseline | Improve outreach quality and targeting; review appointment setting approach |
| Qualified conversations | Are meetings converting to real opportunities? | Qualified opps created ÷ meetings held | AE / SDR | Mid-market and enterprise motions | 40–60% of meetings | Tighten ICP definition; improve discovery questioning |
| Lead response time | How quickly do reps follow up on inbound leads? | Time from lead creation to first contact | AE / SDR | Inbound-heavy motions | Under 5 minutes for best-in-class | Automate first-touch alerts; set SLA in CRM |
| Pipeline additions | Is the team building enough new pipeline each week? | New pipeline value added in period | SDR / AE | Weekly coaching | 3–5× quota coverage target | Increase outreach volume and referral activity |
Performance KPIs (tier 2, lagging)
| KPI | Business question | Formula | Owner | When to use | Typical target | How to improve |
|---|---|---|---|---|---|---|
| Pipeline coverage | Is there enough pipeline to hit quota? | Total pipeline value ÷ quota | Manager / Ops | Always; review weekly | 3–5× quota; enterprise: 4–5× | Increase top-of-funnel activity; improve stage conversion |
| Win rate | What percentage of qualified deals do we close? | Closed-won ÷ total qualified opportunities | AE / Manager | Monthly review | Varies by segment; track vs. prior period | Improve late-stage objection handling; sharpen proposal quality |
| Average deal size | Are we selling at the right level? | Total revenue ÷ number of deals closed | AE / Manager | Monthly | Track vs. target ACV | Focus on multi-stakeholder deals; improve discovery |
| Sales cycle length | How long does it take to close a deal? | Sum of deal durations ÷ number of deals | Manager / Ops | Monthly | Track vs. segment baseline | Identify and remove bottlenecks at each stage; see pipeline stages guide |
| Quota attainment | Are reps hitting their individual targets? | Revenue closed ÷ quota | Rep / Manager | Monthly and quarterly | 80% or more at team level | Coaching on lagging conversion; review territory and quota fairness |
Strategic KPIs (tier 3, board-level)
| KPI | Business question | Formula | Owner | When to use | Typical target | How to improve |
|---|---|---|---|---|---|---|
| Sales velocity | How quickly is revenue moving through the pipeline? | (Opportunities × avg deal size × win rate) ÷ cycle length | Ops / Head of Sales | Monthly | Improve +10% QoQ | Compound small improvements across all four levers |
| CAC | What does it cost to acquire a customer? | Total sales and marketing spend ÷ new customers acquired | Ops / Finance | Quarterly | Varies by segment and ACV | Improve conversion rates; reduce wasted outreach |
| LTV:CAC | Is the business model sustainable? | Customer lifetime value ÷ CAC | Ops / Finance | Quarterly | 3:1 or above for SaaS | Increase retention; improve onboarding and expansion |
| Forecast accuracy | How reliable are our revenue predictions? | Forecast revenue ÷ actual revenue | Manager / Ops | Monthly | Within ±10% of actual | Standardise stage definitions; enforce CRM hygiene |
| Ramp time | How long before a new hire reaches full productivity? | Weeks from start date to first quota attainment | Manager / HR | Quarterly | Track vs. role benchmark | Improve onboarding programme; assign structured coaching from week one |
Pro Tip: Sales velocity is the single formula that ties your whole pipeline together. Even a 10% improvement in win rate, combined with a 10% reduction in cycle length, can increase velocity by more than 20% without adding a single new opportunity.
How to choose which KPIs your team should actually track
The most common mistake is starting with a list of twenty metrics and trying to track them all. Start with your business objective instead, and work backwards.
Step-by-step checklist
- Define the business objective. Is the goal new revenue growth, retention, expansion, or market penetration? The objective determines which tier of KPIs matters most right now.
- Map your funnel stages. Identify the handoff points in your sales process (lead, qualified, proposal, negotiation, closed). Each stage should have at least one leading indicator.
- Pick 3–5 team KPIs and 1–2 rep KPIs. These are the numbers you will review in every team meeting and coaching session. Fewer is almost always better.
- Agree definitions and data sources. Write down exactly how each KPI is calculated, which CRM field it pulls from, and who is responsible for data entry.
- Set cadence and ownership. Assign a named owner for each KPI and decide whether it is reviewed daily, weekly, monthly, or quarterly.
Pro Tip: Apply the rule of thumb from the research: 3–5 core KPIs at team level, never more than 7. Beyond seven, the review conversation becomes a data audit rather than a coaching session.
Role ownership reference
| Role | Primary KPIs | Supporting KPIs |
|---|---|---|
| SDR / BDR | Meetings booked, pipeline additions, lead response time | Qualified conversations, outreach volume |
| Account Executive | Win rate, average deal size, sales cycle length | Quota attainment, qualified conversations |
| Frontline manager | Pipeline coverage, win rate, quota attainment | Forecast accuracy, sales velocity |
| Sales ops | Forecast accuracy, sales velocity, ramp time | CAC, LTV:CAC, data quality |
| Head of Sales | Quota attainment, sales velocity, CAC | LTV:CAC, forecast accuracy, ramp time |
Motion-specific considerations
Different sales motions call for different emphasis. A transactional SMB team should weight meetings booked and win rate heavily, because deal volume is the primary lever. A mid-market team needs pipeline coverage and sales cycle length front and centre. Enterprise motions require close attention to forecast accuracy and average deal size, given the risk concentration in a small number of large deals. Retention and expansion motions should add churn rate and expansion revenue to the core set. For a deeper look at sales team optimisation by stage, the Aheadofsales guide covers this in more detail.
The three KPIs early-stage teams should prioritise first
If your team is early-stage, or you are rebuilding a dashboard from scratch, the evidence points clearly to three KPIs that give you the most signal with the least noise: pipeline coverage, meetings booked, and win rate.
Pipeline coverage tells you whether there is enough opportunity in the funnel to hit quota even if some deals slip. Meetings booked tells you whether the team is generating enough new pipeline to sustain coverage. Win rate tells you whether the quality of those opportunities is good enough to convert. Together, these three give you a complete early-warning system.
Many B2B sellers missed quota in H1 2025, according to Ebsta and Pavilion’s 2025 GTM Benchmarks. Teams that track and act on leading indicators weekly are better positioned to course-correct before the quarter closes.
90-day experiment plan for early-stage teams
Weeks 1–2: Baseline
- Pull current pipeline coverage, meetings booked, and win rate from your CRM.
- Agree definitions with the team. Write them down.
- Set a weekly review slot (30 minutes, same time each week).
Weeks 3–6: Establish rhythm
- Review all three KPIs every week. Note any rep whose meetings booked drops below their personal baseline.
- Run one coaching conversation per week focused on a specific leading indicator, not a general performance review.
- Target: pipeline coverage at 3× quota minimum by week 6.
Weeks 7–10: Coaching interventions
- For reps below win rate baseline, review two recent lost deals together. Identify the stage where deals are stalling.
- For reps below meetings booked baseline, review outreach messaging and targeting. Consider appointment setting techniques.
- Introduce a simple daily stand-up dashboard showing each rep’s meetings booked for the week.
Weeks 11–13: Validate and adjust
- Compare win rate and pipeline coverage at week 13 against the week 1 baseline.
- If pipeline coverage has improved but win rate has not, the problem is qualification, not volume.
- If meetings booked has improved but pipeline coverage has not, check whether meetings are converting to qualified opportunities.
Sample daily stand-up dashboard fields:
- Meetings booked this week (vs. weekly target)
- Pipeline additions this week (£ value)
- Open pipeline coverage ratio (current total ÷ quarterly quota)
- Deals at risk (no activity in 14+ days)
How to set realistic targets and benchmarks for your team
Target-setting is where most managers either play it too safe or set numbers that demoralise the team within six weeks. The most reliable approach combines top-down revenue goals with bottom-up capacity modelling.
Three approaches to target-setting
Top-down allocation. Start with the company revenue target, subtract expected expansion and renewal revenue, and divide the remaining new business target across the team. Adjust for territory size, market maturity, and individual ramp status.
Bottom-up forecasting. Ask each rep to model their own pipeline: how many deals at each stage, expected close dates, and deal sizes. Aggregate these to a team forecast and compare against the top-down target. The gap between the two is your risk.
Hybrid approach. Use top-down to set the quota and bottom-up to validate whether it is achievable given current pipeline and activity levels. This is the most accurate method and the one that produces the most credible board forecasts.
Example calculation. Team revenue target: £1,200,000 for the quarter. Four AEs, each with a £300,000 quota. At a 25% win rate and £30,000 average deal size, each AE needs to close 10 deals. To close 10 deals at 25% win rate, each AE needs 40 qualified opportunities in the pipeline. At 3× pipeline coverage, each AE needs £900,000 in pipeline. That is the number to check in your CRM today.
Benchmark guidance
- Pipeline coverage: 3–5× quota for most motions; enterprise teams should target 4–5× given higher deal risk and longer cycles.
- Win rate: varies significantly by segment and ACV. Track your own trend rather than chasing an industry average. A consistent improvement of 5 percentage points per quarter is meaningful.
- Lead response time: under 5 minutes for inbound leads is best-in-class. Under 1 hour is acceptable. Beyond that, conversion rates drop sharply.
- Quota attainment: aim for 80% or more of the team hitting quota each quarter. If fewer than 60% are hitting, the quota itself may be the problem.
Review cadence table
| Cadence | KPIs reviewed | Owner | Format |
|---|---|---|---|
| Daily | Meetings booked, pipeline additions, lead response time | Rep / SDR | Stand-up or Slack alert |
| Weekly | Pipeline coverage, qualified conversations, deals at risk | Manager | 30-min team review |
| Monthly | Win rate, average deal size, sales cycle length, quota attainment | Manager / Ops | Pipeline review meeting |
| Quarterly | Sales velocity, CAC, LTV:CAC, forecast accuracy, ramp time | Head of Sales / Ops | Board or leadership review |
Quick validation checks before finalising targets: confirm that at least six months of historical data supports the baseline, segment the data by territory and product line rather than using a blended average, and adjust for any reps still in ramp period.
How to track and report KPIs: tools, dashboards, and data hygiene
The best KPI set in the world is useless if the data feeding it is inconsistent or the dashboard is too cluttered to act on. This is where most teams lose the gains they should be making.
CRM and BI tools available in the UK
Most UK sales teams run their KPI tracking through one of three categories of tool: CRM platforms (Salesforce, HubSpot, Pipedrive, and Zoho CRM are the most widely used), BI and reporting layers (Tableau, Microsoft Power BI, Looker), and purpose-built sales analytics tools. Salesforce recommends a scaffold of dashboards that separates executive views from rep-level coaching views, which is a sound model regardless of which platform you use.
For teams exploring how analytics in marketing and AI-driven measurement can complement CRM data, the integration of interaction-quality signals (call summaries, email sentiment, meeting outcomes) is becoming a practical option rather than a future aspiration.
Dashboard patterns that work
MakeTheBoard recommends making KPIs visible on office screens and in Slack to increase team engagement. The dashboard patterns that consistently work are:
- Home board (executive view). Pipeline coverage, quota attainment, forecast vs. target, and sales velocity. One screen, updated daily.
- Pipeline board. All open opportunities by stage, deal size, and close date. Used in weekly pipeline reviews.
- Activity board. Meetings booked, calls made, emails sent, and lead response time by rep. Used in daily stand-ups.
- Stage analysis board. Conversion rates between each pipeline stage. Used monthly to identify where deals stall.
- Rep leaderboard. Individual quota attainment and win rate. Used in monthly one-to-ones.
Dashboard best practice
- Single source of truth: every KPI pulls from one agreed CRM field, not a spreadsheet or a personal tracker.
- Agreed definitions: the calculation for each KPI is written down and accessible to every rep and manager.
- Visual hierarchy: the three most important KPIs for the current period are at the top, not buried in a tab.
- Drill-downs for coaching: every aggregate number should link to the underlying deal or activity data so coaching conversations are grounded in evidence.
- Mobile and remote accessibility: UK teams increasingly work across locations; dashboards must be accessible on mobile without losing key data.
Data hygiene checklist
- Standardise required CRM fields: close date, deal value, stage, and next action are non-negotiable.
- Integrate calendar and telephony tools so meetings and calls log automatically rather than relying on manual entry.
- Connect marketing automation to track lead source and response time accurately.
- Run a monthly data audit: flag deals with no activity in 21 days, missing close dates, or stages that have not moved in 30 days.
- Set automated alerts for pipeline coverage drops below 3× and lead response times above 1 hour.
For a structured look at sales coaching software that integrates with these dashboard patterns, the Aheadofsales comparison resource covers the main options available to UK teams.
Five pitfalls that undermine KPI programmes and how to fix them
1. Tracking too many KPIs
The remedy: cut your team dashboard to three to five KPIs maximum (never more than seven), and review the rest quarterly rather than weekly. Every metric that does not prompt a specific action within 48 hours is a distraction.
2. Unclear or inconsistent definitions
A team where two managers calculate win rate differently cannot compare performance, spot trends, or coach consistently. The remedy: write a one-paragraph definition for each KPI, agree it with the team, and store it in your CRM or shared wiki. Review definitions every six months.
3. Acting only on lagging indicators
A manager who only reviews win rate and quota attainment at month-end has no time to intervene. By the time a lagging indicator moves, the quarter is already decided. The remedy: spend 60% of your review time on leading indicators (meetings booked, pipeline additions, lead response time) and use lagging indicators to validate whether the activity is converting.
4. Poor data hygiene
Here is a scenario that plays out in many teams: pipeline coverage looks healthy at 4× quota, but a data audit reveals that 30% of the pipeline consists of deals with close dates that have slipped three or more times. The real coverage is closer to 2.8×, and the team is heading for a miss. The remedy: run a monthly data audit and make CRM hygiene a standing agenda item in your weekly review.
5. Misaligned incentives
Measuring reps on call volume produces call volume. Measuring them on qualified conversations produces better pipeline. If your KPIs and your commission structure point in different directions, reps will follow the money, not the dashboard. The remedy: align at least one primary rep KPI directly to the commission plan so the incentive and the measurement reinforce each other. The sales performance improvement guide from Aheadofsales covers incentive alignment in more detail.
Key takeaways
The most effective approach to sales team KPIs is to pick a small, tiered set tied to your business objective, assign a named owner to each, and act on leading indicators weekly rather than waiting for lagging ones to confirm a problem.
| Point | Details |
|---|---|
| Start with three core KPIs | Pipeline coverage, meetings booked, and win rate give early-stage teams the clearest signal. |
| Use the tiering model | Leading indicators reviewed weekly; lagging indicators reviewed monthly; strategic KPIs reviewed quarterly. |
| Keep the dashboard tight | Track three to five core KPIs at team level; avoid tracking more than seven, as a higher number reduces coaching quality and focus. |
| Fix data hygiene first | Agreed definitions and clean CRM data matter more than the sophistication of the dashboard. |
| Aheadofsales coaching | Bespoke 1:1 coaching and team workshops help UK sales teams translate KPI data into consistent quota attainment. |
The KPI conversation most managers are not having
There is a version of KPI management that looks rigorous but achieves very little. The dashboard is full, the weekly review happens on time, and the numbers are technically accurate. Yet the team keeps missing quota. The problem, almost every time, is that the KPIs are being reported rather than acted on.
The distinction matters. Reporting a KPI means reading the number out loud in a meeting. Acting on a KPI means linking it to a specific seller behaviour, finding the evidence for that behaviour (a call recording, a meeting note, a CRM entry), and coaching the rep on that observable moment. That is the difference between a data review and a coaching conversation.
What I see most often when working with sales teams is that managers are comfortable with the numbers but uncomfortable with the conversation the numbers are pointing to. A rep with a low win rate does not need to be told their win rate is low. They need someone to sit with them, review two recent lost deals, and identify the specific moment in the sales process where the deal started to slip. That is where the improvement lives.
The 90-day experiment plan in this guide is designed precisely for that. It forces a weekly coaching rhythm anchored to leading indicators, so the conversation happens while there is still time to change the outcome. Teams that commit to that rhythm consistently see pipeline coverage and win rate improve within a single quarter, not because they discovered a new metric, but because they started using the ones they already had.
How Aheadofsales helps UK sales teams improve their KPIs
If you have read this far, you have a clear picture of which KPIs to track, how to set targets, and what a good review cadence looks like. The harder part is building the habits and coaching skills to act on that data consistently, week after week.

Aheadofsales works with growth-minded UK businesses to do exactly that. The bespoke sales training and coaching programmes combine 1:1 coaching with team workshops and, where needed, fractional sales director support to give your team both the skills and the accountability structure to hit target every quarter. Packages are designed for businesses with 5–1,000 staff, from SaaS scale-ups to professional service firms, with investment starting from £4,500.
The starting point is always a diagnostic: a clear-eyed look at your current KPIs, data quality, and coaching cadence to identify the two or three changes that will move the needle fastest. If you want that conversation, book a discovery call with the Aheadofsales team and we will tell you honestly where the gaps are and what it would take to close them.
Useful sources and further reading
The following sources informed this guide and are worth bookmarking for ongoing reference:
- Gartner: Sales performance metrics. The authoritative source for the tiered KPI framework linking strategic goals to seller behaviours. Particularly useful for UK sales leaders building board-level reporting.
- Claap: 12 sales metrics that actually matter in 2026. Covers the sales velocity formula, lead response time benchmarks, and the H1 2025 quota attainment data. Practical and well-evidenced.
- SyncGTM: KPIs for B2B Sales. The most thorough treatment of the early-stage priority trio (pipeline coverage, meetings booked, win rate) and the rule of thumb on KPI count. Directly applicable to UK B2B teams.
- MakeTheBoard: Sales KPIs every manager should track. Strong on dashboard design and the importance of visibility and coaching workflow. Useful for managers setting up or auditing their reporting setup.
- Salesforce: 9 Sales KPIs every sales team should be tracking. Covers the full dashboard scaffold (state-of-union, pipeline, activity, stage analysis, rep leaderboard) and AI-assisted call summaries. Relevant for Salesforce users and useful as a structural model for any CRM.
- Wikipedia: Performance indicator. Foundational reference for the definition and taxonomy of KPIs versus metrics. Useful background for managers who want to ground their KPI language in established terminology.
- Aheadofsales: Sales team performance explained. Covers which KPIs to track by role and team stage, with UK-specific context. A practical companion to this guide.
- Aheadofsales: Sales performance improvement guide. Detailed approaches for improving win rate and quota attainment, including incentive alignment. Recommended for managers whose teams are consistently missing target.