
A sales process map is a visual blueprint showing every stage, action, decision point and handoff a deal passes through, from first contact to close. Build one properly and you get three things almost immediately: visibility into where deals actually die, clarity on who owns each handoff, and a reliable way to spot bottlenecks before they wreck your forecast.
You need one now if any of this sounds familiar:
- Your forecast has been wrong two quarters running, and nobody can say why.
- Reps describe “the process” five different ways in the same team meeting.
- Deals stall at handoffs between SDR, AE and customer success, with no one owning the gap.
Structural fixes to a sales process typically take one to two quarters to show up in win rate and cycle length, so the sooner you map, the sooner that clock starts. The next step isn’t a slide deck. It’s pulling forty real deals from your CRM and seeing what actually happened.
Key Takeaways
Sales process mapping works because it replaces guesswork about your pipeline with a documented, ownership-assigned, measurable structure built from real CRM data rather than memory.
| Point | Details |
|---|---|
| Start from records, not opinion | Pull 20 closed-won and 20 closed-lost deals from the CRM before running any workshop. |
| Use the 5-box template as a default | Prospect, Qualify, Demo/Proposal, Negotiate, Close covers most B2B workflows without over-engineering. |
| Name an owner for every box | A box without an owner and exit criteria is a gap, not a process step. |
| Tie exits to buyer commitments | Forecast accuracy improves when stages close on buyer actions, not seller activity. |
| Change the map at period boundaries only | Structural changes typically take one to two quarters to show in win rate and cycle length. |
Table of Contents
- What is sales process mapping, and which format should you use?
- What does a sales process map actually look like?
- Why does mapping the sales process matter?
- How do you create a sales process map?
- Which metrics and tools make the map actionable?
- What workshop format actually makes a map stick?
- How do you turn the map into a working playbook?
- Who’s behind this guidance?
- What’s the honest take on how most teams approach this?
- Frequently asked questions
- Sources
What is sales process mapping, and which format should you use?
Sales process mapping is the exercise of documenting your buying and selling motion as a diagram, distinct from your CRM pipeline (which just tracks deal status) and your playbook (which tells reps what to say). The map sits between the two: it shows the shape of the process before the playbook tells reps how to move through it.
Four visual formats cover most B2B needs:
- Linear flowchart – simplest option, best for a single, predictable path with few branches.
- Swimlane diagram – separates actions by owner (SDR, AE, Sales Engineer, CS), ideal when handoffs are the problem.
- 5-box workflow – a compressed, one-page version covering entry, three or four core stages, and exit; the format most teams should start with.
- Customer journey map – plots the buyer’s experience and decisions alongside seller actions, useful when you’re redesigning stage exit criteria around buyer commitments rather than seller activity.
Keeping outputs to a small number of core workflows, typically five, avoids the tangled “wall of arrows” that makes most first attempts at mapping unusable.
What does a sales process map actually look like?
Three worked examples, each stripped to the essentials.
SMB outbound. Entry criteria: a booked discovery call from an inbound or outbound touch. Owner: SDR through to qualification, then AE. Outcome: deal enters “proposal sent” or exits as “no fit” within 14 days median.
Mid-market discovery to proposal. Discovery call → technical fit review → decision fork (champion identified or not) → proposal drafted → exec review. Mark every fork with both exits: which deals proceed, and which drop to “no decision” versus “disqualified.”
5-box workflow template. Prospect → Qualify → Demo/Proposal → Negotiate → Close. Use this as your default skeleton for any workflow that doesn’t yet have a bespoke map, then adapt the boxes to your own pipeline stages.
Pro Tip: Keep every map to one page and build it inside the tool your reps already use, whether that’s HubSpot, Salesforce, or a simpler CRM. A map that only lives in a slide deck gets opened once and forgotten.
Why does mapping the sales process matter?
A map is a diagnostic instrument before it’s a communication tool. Draw one properly and you’ll immediately see stage-skipping (deals jumping from “contacted” to “proposal” with no qualification step logged), and you’ll finally separate disqualified deals from no-decision ones, which is the difference between a lead problem and a product-fit problem.
The knock-on effects show up in three places:
- Forecast accuracy improves once exit criteria are tied to buyer actions rather than rep activity, because “buyer shared internal evaluation criteria” is harder to fake than “sent proposal.”
- Coaching focus sharpens when you can see exactly which box a rep’s deals stall in, rather than guessing from win rate alone.
- Cycle time drops once you can see where median duration per box is inflated by a handoff nobody owns.
Speed-to-lead is one of the clearest levers mapping exposes. Response time to a new lead materially affects conversion, yet it rarely gets fixed until a map puts it in front of the people who own the SLA.
How do you create a sales process map?
Six steps, run in order, no shortcuts on step one.
-
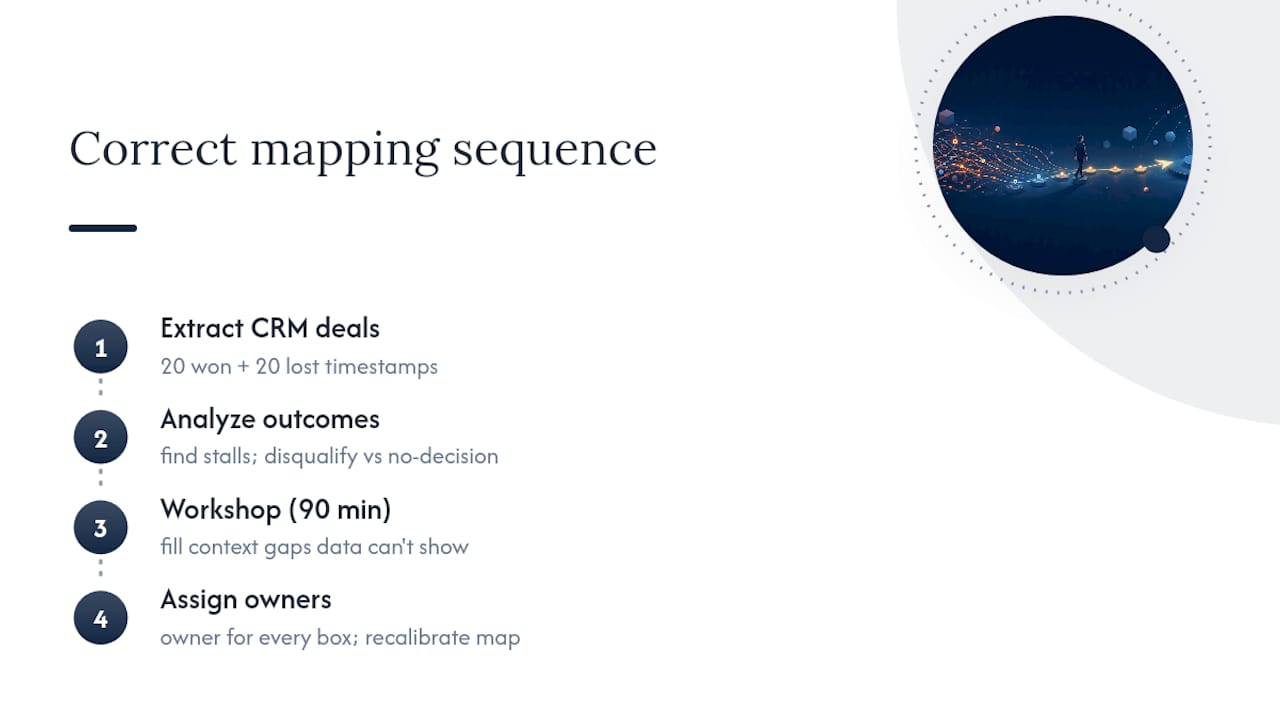
Pull the data before you draw anything. Extract events from CRM records for 20 recent closed-won deals and 20 closed-lost deals. Capture observable timestamps, not memory, because deriving the current state from records rather than recollection is what separates a useful map from wishful thinking.
-
Interview by deal, not by process. Ask a rep “walk me through the Henderson deal” rather than “what’s our sales process?” Asking about specific deals recovers missing context, such as who was actually involved and what they were waiting on, whereas abstract process questions get you the textbook answer, not the real one.
-
Draw the current state first. Every path, every exit reason (won, lost, disqualified, no decision), and median duration per box. This is the unglamorous part everyone wants to skip, and it’s the one that makes the rest of the exercise honest.
-
Annotate the deltas. Compare what reps remembered against what the CRM recorded. The gaps, not the agreements, tell you where training or tooling is broken. Only design the future state once you understand why the current one drifted.
-
Define entry and exit criteria, and assign an owner to every box. No box should exist without a named owner, a measurable outcome, and, where a handoff is involved, an SLA. This is where you also decide how each stage maps to your buyer journey.
-
Pilot for one full period boundary, then re-check open deals. Don’t retrofit the new map onto historic deals. Run it forward for a month or a quarter, reconcile any deals still open under the old structure, and iterate based on the new cohort’s results, since structural changes typically need one to two quarters before win rate and cycle length shift meaningfully.
Pro Tip: Treat the map as a measuring instrument, not artwork. Change it mid-quarter and you break comparability with every cohort measured before the change, so save edits for a clean period boundary.
Which metrics and tools make the map actionable?
A map without measurement is decoration. Track five KPIs against every box: conversion rate between stages, median time per box, speed-to-lead, win/loss split by named exit reason, and forecast accuracy against actuals. Median duration matters more than average here, because a handful of stalled outlier deals will otherwise drag your averages into meaninglessness.
Tying exit criteria to buyer commitments rather than seller activity is what makes forecast accuracy improve at all. A stage that exits on “rep sent proposal” tells you nothing about buyer intent; a stage that exits on “buyer shared internal evaluation criteria” tells you where the deal genuinely stands.
| Tool layer | Role in operationalising the map |
|---|---|
| CRM (e.g. HubSpot, Salesforce) | System of record for stage timestamps, exit reasons and durations |
| Thin mapping/diagram tools | Draft and version the visual current and future state maps |
| Dashboards | Surface stage-by-stage conversion and speed-to-lead in real time |
| Automation/workflow rules | Enforce handoff SLAs and flag deals that skip a required step |
Automation carries real weight here: AI-assisted note-taking, personalisation and proposal tracking can shorten cycle time once the map tells you which handoffs are worth automating first. The map needs to live inside your team’s pipeline stage structure, not bolted on as a separate reference document nobody opens.
What workshop format actually makes a map stick?
Run one focused 90-minute workshop per workflow, not a single marathon session trying to cover every motion your business has. A 90-minute session is enough to produce a usable first-draft map for one workflow, with a facilitator, the workflow’s frontline reps, and at least one manager who can settle ownership disputes on the spot.
- Assign one named owner per workflow, not per box, so accountability for the whole map sits with someone.
- Set a 30 to 60 day refresh cycle rather than leaving the map static for a year.
- Change the map only at a period boundary, never mid-cycle, to protect cohort comparability.
- Document entry criteria, owner, median duration, and every named exit for each box, with nothing left as “it depends.”
Pro Tip: If a box on your map has no owner, it isn’t a step. It’s a place where deals go to die quietly.
How do you turn the map into a working playbook?
A map tells you the shape of the process; a playbook tells reps what to do inside it. Convert each box into a playbook step with acceptance criteria (what “done” looks like) and, where useful, a suggested script or talk track for that specific stage. This is the point where MEDDIC or BANT earn their place: MEDDIC works well for mapping qualification depth in complex, multi-stakeholder deals, while BANT suits faster-cycle, budget-led qualification in SMB motions. Either framework should slot into the map’s qualification box rather than replace the map itself.
- Embed SLAs and mutual action plans directly into the boxes where handoffs happen, and enforce them with automation wherever your CRM allows.
- Pull map-derived metrics (stage conversion, median duration, exit reasons) into weekly forecast huddles and 1:1 coaching, so coaching conversations are anchored to real data rather than gut feel.
- Feed the playbook back into onboarding so new reps learn the mapped process, not a legacy one nobody’s updated.
The sales playbook guide covers this conversion in more depth, including template structures for scripts tied to each stage.
Who’s behind this guidance?
This piece is written by Jerry at Aheadofsales, drawing on years of hands-on sales training and consultancy work with B2B teams across the UK.
- Aheadofsales works directly with businesses to run mapping workshops, then builds the coaching and training programme around what the map reveals.
- Full author background sits on our author page, alongside case studies from client engagements.
- Explore our sales consultancy services for a sense of how these workshops run in practice, with client proof points added as engagements close.
What’s the honest take on how most teams approach this?
Most advice on sales process mapping starts in the wrong place: a workshop, a whiteboard, a room full of opinions about how the process “should” work. That produces a map of what people believe happens, which is usually a tidier and more flattering version of reality than the CRM will admit to.
The better sequence runs backwards from the conventional wisdom. Pull 20 closed-won and 20 closed-lost deals from the CRM first. Let the timestamps tell you where deals actually stalled, which exits were disqualified versus no-decision, and how long each box really took. Only then run the 90-minute workshop, because now you’re using it for what it’s actually good for: filling in context the data can’t show you, not inventing a process from scratch.
What’s overrated is treating the finished map as permanent. It’s a measuring instrument, and instruments need recalibrating. What’s underrated is the sheer discipline of naming an owner for every single box. Teams skip this constantly, and it’s the single biggest reason maps get built once and then quietly ignored.
Frequently asked questions
What is sales process mapping used for?
It’s used to visually document every stage, decision point and handoff in a sales workflow, so teams can spot bottlenecks, assign ownership and measure conversion between stages accurately.
How is a sales process map different from a CRM pipeline?
A CRM pipeline tracks live deal status; a sales process map documents the shape of the workflow itself, including entry criteria, owners and exit reasons, independent of any single live deal.
Should I map the process I intend to run, or the one reps actually follow?
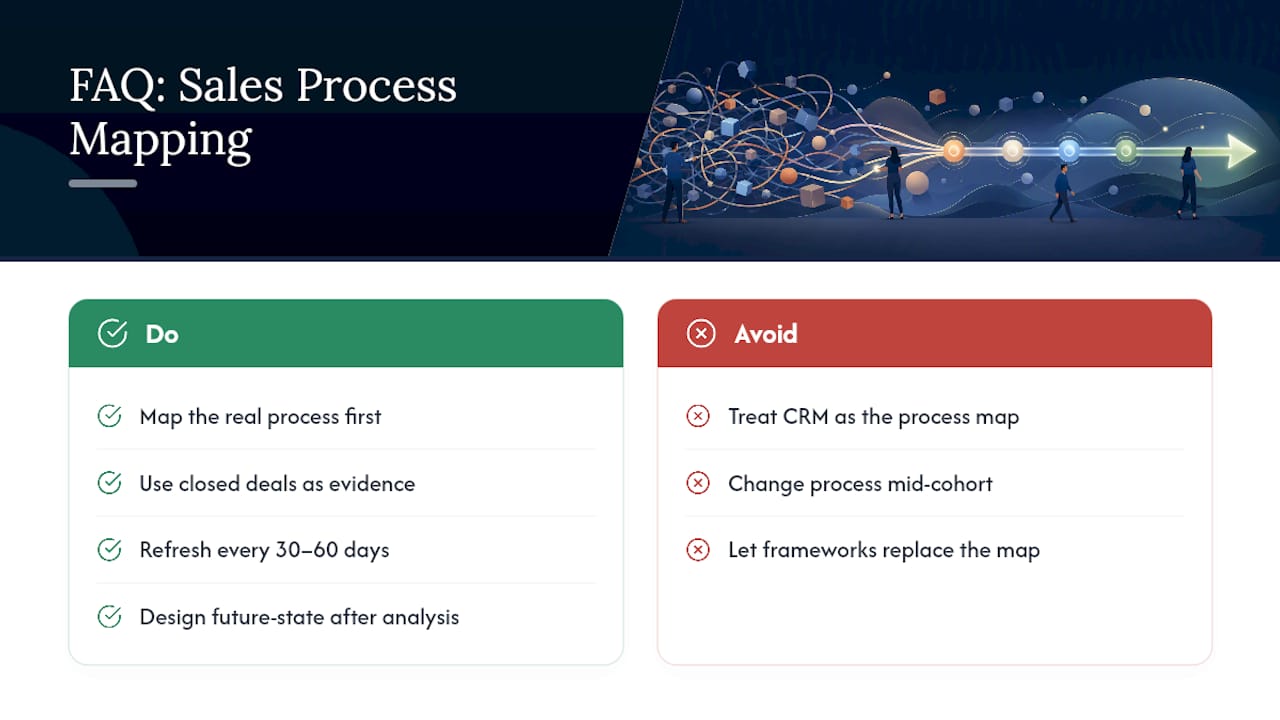
Map what actually happens first, using closed deals from the CRM as evidence. Only design the intended future-state process once you understand where the real process diverges from the taught one.
How often should a sales process map be updated?
Refresh it every 30 to 60 days, and only change it at a clean period boundary so you don’t break comparability between deal cohorts measured before and after the change.
Do frameworks like MEDDIC or BANT replace the need for a map?
No. MEDDIC and BANT are qualification frameworks that slot into specific boxes on your map, typically the qualification stage, rather than replacing the overall visual structure of the process.
Sources
- Sales Process Mapping: Draw What Happens, Not What Should | RevenueFlow
- Sales Workflow Mapping: The Step-by-Step Guide for 2026 — Gangly Blog
- Sales optimization: How to optimize sales performance across your entire funnel
- Sales process optimization — Pipeline / ZoomInfo