
Yes, and the calculation is simpler than most L&D reports make it look: ROI = (value of the improvements minus the investment) ÷ the investment, expressed as a percentage. Reinforced, continuous training programmes deliver an average ROI of around 353%, though one-off workshops rarely come close. Everything below shows you how to build your own defensible number.
TL;DR:
- Tracking only inputs like attendance or completion certificates provides no insight into actual behavior or revenue changes.
- Measuring sales training ROI requires at least eight to twelve weeks of baseline data and proper control groups to produce credible results.
- Leading indicators such as call scores and stage conversions typically shift within 30 to 45 days, while revenue outcomes may take several months to surface.
- Combining structured training with ongoing coaching yields the best long-term ROI, and measurement should begin before training starts.
- Direct and indirect training costs, including rep and manager time, must be explicitly accounted for to produce accurate ROI calculations.
Table of Contents
- Why measuring sales training ROI is difficult
- Which leading and lagging indicators should you track?
- Step-by-step measurement framework: baseline, test, convert
- Calculation templates and worked examples
- Tools, data sources and dashboards to automate measurement
- Attribution strategies and common pitfalls
- How to present sales training ROI to leadership
- Benchmarking sales training ROI against industry standards
- What do successful sales training ROI case studies actually show?
- Does the training format (online, in-person, blended) change the ROI?
- What costs go into the sales training ROI calculation?
- Our perspective on what actually moves the needle
- Ready to put a number on your training investment?
- Sources
Why measuring sales training ROI is difficult
Revenue never moves for one reason. A rep closes more deals after training, but the market also shifted, a competitor raised prices, and your best account manager finally hired the assistant she’d been asking for since March. Untangling which of those actually caused the lift is the whole game, and it’s why so many training reports collapse under scrutiny the moment a finance director asks “compared to what?”
Attribution is the core problem, but it’s not the only one. Behaviour change shows up in call recordings and CRM activity weeks before it shows up in closed revenue, so measuring too early makes good training look worthless. Measure too late, and a dozen other variables have muddied the water beyond recognition.
A handful of specific errors show up again and again in the way businesses try to measure this:
- Tracking inputs instead of outcomes. Counting attendance or completion certificates tells you nothing about whether behaviour, or revenue, actually changed.
- Sampling too small a group. Judging a programme on three reps’ results is statistical noise dressed up as insight.
- Ignoring margin. A revenue increase driven by heavier discounting isn’t a training win. It’s a training cost in disguise.
- Skipping the baseline. Without a “before” number, any “after” number is just a guess wearing a suit.
Independent compilations back this up starkly: structured programmes tend to raise quota attainment by 16 to 20%, with win rates up around 18%, yet only a minority of enablement teams can directly tie their programmes to revenue. The gap isn’t a lack of impact. It’s a lack of instrumentation.
The fix starts before training even begins. Decide on the one or two business outcomes you actually care about (win rate, ramp time, average deal size), and build your measurement plan around those, not around the training content itself. Everything downstream gets easier once that single decision is made.
Which leading and lagging indicators should you track?
Leading indicators tell you behaviour is changing. Lagging indicators tell you whether that behaviour change turned into money. You need both, because leading indicators move fast and reassure stakeholders early, while lagging indicators are the ones that actually justify the budget line.
Leading indicators worth watching:
- Call scores from structured scorecards (discovery quality, objection handling, next-step clarity)
- Stage-to-stage conversion rates within the pipeline
- Demo-to-proposal conversion and demo quality ratings
- Multi-threading (number of stakeholders engaged per opportunity)
- Activity quality, not just volume (meaningful conversations logged, not dial counts)
Lagging indicators worth watching:
- Win rate
- Average contract value (ACV)
- Sales cycle length
- Quota attainment
- Time-to-first-deal for new hires (ramp time)
- Rep turnover, which quietly erodes every other number on this list
Pro Tip: Pick your lagging metric first, then work backwards to the leading indicators that actually predict it. If ramp time is your goal, track new-hire call scores and stage conversion in week two, not company-wide activity volume.
Leading indicators typically shift within 30 to 45 days, while revenue outcomes may take several months to surface, depending on your sales cycle length. That timing gap is precisely why treating a two-week spike as proof of ROI gets so many training investments cancelled prematurely. Give the lagging number time to catch up before you judge the programme by it.
If your business is chasing new logos, prioritise win rate and stage conversion. If retention and expansion matter more, watch ACV and cycle time on renewals instead. Trying to track everything at once is how most measurement efforts quietly die by month three.
Step-by-step measurement framework: baseline, test, convert
A repeatable process beats a one-off audit every time, because it lets you compare this quarter’s coaching cohort against the last one without reinventing your methodology.
- Define the business outcome first. Pick one or two target metrics (win rate, ramp time, ACV) before you touch the training content itself.
- Collect baseline data. Pull at least eight to twelve weeks of rep or cohort-level performance history before training starts. Smaller samples make noise look like signal.
- Choose your test design. A control group (a comparable team that doesn’t receive the training) gives the cleanest read. Where that’s impractical, use rep-as-own-baseline, comparing each rep’s pre and post numbers against themselves.
- Instrument leading indicators early. Set up call scoring or CRM stage tracking so you get a behavioural read within the first month.
- Schedule lagging outcome checks. Build revenue and win-rate reviews into your calendar at 60, 90 and 180 days. Don’t wait for someone to ask.
- Convert the delta into money. Multiply the metric improvement by the relevant financial driver (deal volume, average deal size, or quota value) to produce a pound figure.
This mirrors the four-level coaching ROI model: activity and engagement, skill improvement, pipeline behaviour, and finally revenue. Reporting all four levels, rather than jumping straight to revenue, gives sceptical stakeholders a trail they can actually follow.
Pro Tip: Run your control-group comparison over a rolling 90-day window rather than a fixed quarter. Fixed quarters catch seasonal noise; rolling windows smooth it out.
Data quality matters more than sophistication here. A messy CRM with inconsistent stage definitions will wreck even the best-designed control group, so agree on what counts as a “qualified opportunity” before you start collecting numbers, not after.
Calculation templates and worked examples
The formula stays constant regardless of what you’re measuring:
ROI = (Value of Improvement − Investment) ÷ Investment × 100
Two worked examples show how this plays out with real inputs.
Worked example 2: ramp-time reduction. If training cuts new-hire ramp time from 16 weeks to 12 weeks across 6 new hires, and each rep’s weekly quota is worth £2,500 in gross margin, that’s 4 weeks × 6 reps × £2,500 = £60,000 in recovered productive time, against a training cost of, say, £5,000.
Build these into a simple spreadsheet with exposed assumptions: average deal size, margin percentage, number of reps, and the baseline period used. Never bury the assumptions in a locked cell. The moment a finance director can’t see how you got to your number, they’ll assume you got it wrong.
- Keep conservative, central and optimistic versions of every calculation.
- Label which inputs are measured versus estimated.
- Re-run the calculation quarterly, not just once at launch.
Tools, data sources and dashboards to automate measurement
Your CRM is doing most of the heavy lifting already, even if nobody’s built the report yet. Pull opportunity conversion by stage, sales velocity, and ACV fields segmented by rep and cohort. Most platforms can filter this by training start date if you tag it properly from day one.

Conversation intelligence and call scoring tools capture the leading indicators that surveys and gut feel never will, things like objection-handling quality and next-step clarity on a live call, and this guide to coaching from call outcomes breaks down how to turn recorded calls into structured scores rather than anecdotal feedback.
Dedicated coaching platforms centralise scorecards and progress tracking, but a well-built spreadsheet does the job for teams under 20 reps. Don’t buy software before you’ve proven a manual process works. Automate the parts that are genuinely repetitive, like weekly scorecard aggregation, and leave judgement calls to a human for now. The minimal integration that pays off fastest is usually CRM plus call recording, in that order.
Attribution strategies and common pitfalls
Control groups are the gold standard, and setting one up is simpler than it sounds: split a comparable team by region or account list, train one half now, and delay the other half by 90 days. Compare their metrics over the same period.
Where a true control group isn’t possible, adjust for market-wide movement.
- Don’t judge results on windows shorter than 60 days. Short windows catch noise, not signal.
- Don’t rely on samples under eight to ten reps. Individual variation swamps the average.
- Don’t count training inputs (hours delivered, modules completed) as if they were outcomes.
- Don’t ignore margin erosion from heavier discounting used to “help” close rates.
Pro Tip: If a competitor exits the market or a major price change lands mid-measurement, note it explicitly in your report rather than hoping nobody asks. Transparency about confounders builds more credibility than a suspiciously clean number.
How to present sales training ROI to leadership
Executives don’t want the methodology first. They want the headline number, then the confidence they can trust it.
- Lead with the headline ROI and a confidence range, not a single precise figure. “180% to 240%, central estimate 210%” reads as credible; “213.7%” reads as invented.
- Show your calculation steps on one slide. Baseline, delta, financial driver, result. Nothing hidden.
- Present three scenarios: conservative, central, and optimistic, so the room can choose their own comfort level rather than arguing with your single number.
- Close with next actions and cadence. State exactly when you’ll report again, quarterly is standard, and what decision the leadership team needs to make now.
Benchmarking sales training ROI against industry standards
The 353% figure gets quoted constantly, but it applies specifically to reinforced, continuous training programmes, not a single two-day workshop. Treat it as a ceiling for what’s achievable with ongoing coaching, not a floor you’re expected to hit immediately.
More useful for calibrating your own results are the mid-range figures: 16 to 20% higher quota attainment and an 18% win-rate lift at organisations running structured programmes. If your own numbers land near there, you’re performing in line with well-run peers, not underperforming a headline statistic pulled from a best-case study.
Benchmark against your own historical baseline before you benchmark against industry averages.
What do successful sales training ROI case studies actually show?
The strongest examples share a structure, not just a strong number. They start with a documented baseline, use a comparison group or a clearly stated rep-as-own-baseline method, and show their working rather than presenting a single headline figure.
The former can be checked. The latter usually can’t.
The most credible published examples also separate training from coaching in how they report results. A one-time workshop that produced a temporary bump, followed by a decay back towards baseline within two months, tells a different story to a coaching engagement that shows the lift holding steady at month six. That distinction between a transfer of knowledge and ongoing reinforcement is exactly why sustained programmes tend to post the stronger long-term numbers.
When you evaluate a case study, whether your own or a vendor’s, ask three questions: what was the baseline period, what was the comparison method, and does the number hold up 90 days after the training ended? If any of those three is missing, treat the headline figure as marketing, not measurement.
Does the training format (online, in-person, blended) change the ROI?
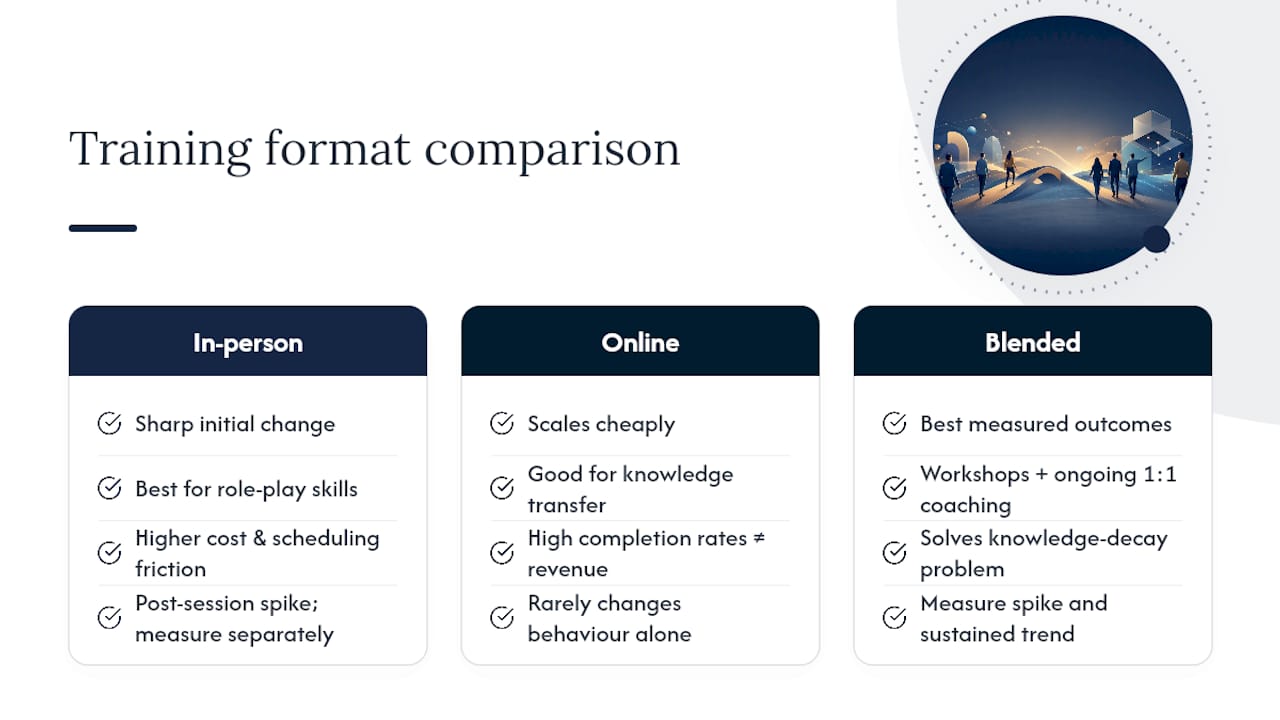
Format matters less than reinforcement, but it isn’t irrelevant. In-person training tends to produce sharper initial behaviour change, particularly for skills like objection handling that benefit from live role-play and immediate feedback. The trade-off is cost and scheduling friction across a distributed team.
Online, self-paced modules scale cheaply and suit knowledge transfer (product updates, process changes) but rarely shift behaviour on their own. Completion rates look good on a dashboard and mean very little for revenue, which is exactly the “tracking inputs” trap from earlier.
Blended programmes, combining structured live sessions with ongoing 1:1 coaching, consistently show the best measured outcomes because they solve the knowledge-decay problem baked into single-format training. A workshop delivers information once.
For measurement purposes, the practical implication is this: if you’re running a blended programme, separate your leading-indicator tracking by phase. Measure the immediate post-workshop spike separately from the sustained coaching-driven trend line, because conflating the two will make a solid coaching programme look like it’s decaying when it’s actually the temporary workshop effect wearing off on schedule.
What costs go into the sales training ROI calculation?
Most ROI calculations undercount the investment side, which quietly inflates the reported percentage and invites exactly the scepticism you’re trying to avoid.
Direct costs are the obvious ones: trainer or consultancy fees, licence costs for any coaching platform, materials, and venue hire for in-person sessions. Indirect costs are where most calculations fall short:
- Rep time out of seat. Hours spent in training are hours not spent selling. Value this at the rep’s average revenue-per-hour, even roughly.
- Manager time. Sales leaders running coaching sessions or reviewing scorecards aren’t managing pipeline during that time.
- Ramp-up dip. New behaviours sometimes create a short-term productivity dip before they produce a lift. Some organisations model this explicitly as a cost.
- Internal admin. Someone has to schedule, track completion and chase data. That time has a cost too, even if it’s modest.
State your cost boundary explicitly in every report, and use the same boundary every time you re-measure.
Our perspective on what actually moves the needle
Most of the sales training ROI conversation focuses on proving a number after the fact. We think that’s backwards. The businesses getting genuinely defensible, repeatable ROI figures are the ones who built measurement into the programme design before a single session ran, not the ones scrambling to justify spend after the fact with whatever CRM export they can find.
Knowledge decays fast without reinforcement, and a single event can’t compete with continuous coaching that keeps testing and correcting behaviour week after week. Our approach at Aheadofsales pairs bespoke 1:1 coaching with structured training precisely because the combination is what sustains the lift long enough to convert into a measurable, revenue-level number rather than a temporary spike that fades by month two.
If you’re evaluating any provider, ask three questions before you sign anything: do they define a baseline before training starts, do they measure both leading and lagging indicators, and do they show you the calculation rather than just the headline claim? A provider who can’t answer all three plainly probably can’t prove their own results either.
— Jerry
Ready to put a number on your training investment?
Aheadofsales builds the measurement plan into the coaching engagement from day one, rather than leaving you to reverse-engineer an ROI figure six months later from a patchy CRM export. Where generic training providers hand you a completion certificate and move on, our bespoke 1:1 coaching pairs with your existing sales process to track leading and lagging indicators from the first session, so the pound figure you present to leadership is one you can actually defend.
That matters most for growing B2B teams and service businesses where a single percentage point of win rate translates into real revenue, not a vanity metric on a slide. Our sales training packages start with a baseline assessment before a single coaching session runs, and our SaaS-specific programmes build in the exact framework outlined above. If you’re ready to see what a properly instrumented training programme could return for your team, get in touch to discuss a baseline assessment and a tailored coaching plan built around the outcomes that matter to your business.
Sources
For readers who want to check the original figures: the Forbes analysis on training ROI, ATD’s measurement framework, Vozah’s statistics compilation, and GradeMyClose’s four-level coaching model all provide the underlying data referenced above.
- Sales Training ROI: Turning Investment Into Tangible Results — Forbes
- Sales training ROI statistics 2026: 20+ cited numbers — Vozah
- Sales coaching 101 — Pipedrive blog
One Response