
Sales capacity planning tells you exactly how many sellers you need, and when to hire them, to hit your bookings target. The core formula is straightforward:
Reps needed = Bookings target ÷ (Quota per rep × Expected attainment % × Ramp contribution %)
Quick SaaS example: you need a significant amount of new ARR this year. Adjusting for ramp contribution increases the number of reps required significantly compared to planning without it.
To build this immediately, you need two things:
- CRM data (closed-won bookings, pipeline by stage, average deal size, sales cycle length) from Salesforce or HubSpot CRM
- A modelling sheet in Excel or Google Sheets with a roster tab, an assumptions tab, and an outputs tab
That’s the whole engine. Everything below shows you how to build it properly, validate it, and turn it into a hiring plan your finance team will trust.
Key takeaways
Effective sales capacity planning requires clean CRM and HRIS data, realistic attainment-adjusted assumptions, and a monthly time-phased model that accounts for ramp, attrition, and hiring lag before any requisition is opened.
| Point | Details |
|---|---|
| Use attainment, not quota | Model on historical attainment (e.g. 78%), never on quota face value, to avoid understating headcount need. |
| Ramp adds 30–50% to seat requirements | A 5-month ramp curve means new hires contribute far less than a fully productive rep; always model partial contributions monthly. |
| Work backwards from need date | Subtract ramp duration and time-to-fill from the date you need full productivity to set your requisition open date. |
| Coaching can replace a hire | A 10-percentage-point attainment improvement across an existing team often delivers the same bookings as 1–2 new hires at lower cost and with no ramp delay. |
| Aheadofsales closes the gap | Bespoke capacity workshops and fractional sales director support help UK B2B teams validate assumptions and lift attainment before committing to headcount. |
Table of Contents
- What is sales capacity planning and why does it matter?
- What CRM and HRIS data do you need before you model?
- What assumption drivers does your model need?
- How do you build a monthly, time-phased capacity model?
- Two worked examples: SaaS and professional services
- How do you turn model outputs into a hiring plan?
- Common pitfalls and how to validate your model
- Practitioner checklist for operationalising your capacity model
- How to use your capacity planning template effectively
- When should you run a full model versus a quick check?
- How Aheadofsales helps you move from model to results
- Sources
What is sales capacity planning and why does it matter?
Sales capacity planning (also called sales force planning or quota capacity modelling) is the discipline of converting a revenue target into the precise number of sellers and the hiring timeline required to deliver it. The primary output is a monthly, time-phased view of ramped full-time equivalents (FTEs) versus your bookings target, so you can see gaps before they become missed quarters.
The reason it matters so much is alignment. Without a shared model, sales leadership tends to optimise for headcount, finance optimises for cost, and recruiting plans for time-to-fill in isolation. A capacity model forces all three groups to agree on the same assumptions before anyone opens a requisition.
Who needs to be in the room:
- Sales leadership: owns quota assumptions and territory design
- FP&A: owns the revenue target and cost envelope
- Talent and recruiting: owns time-to-fill and offer-acceptance rates
- Sales enablement: owns ramp curves and productivity benchmarks
The model sits inside your annual planning cycle but should be refreshed quarterly. It feeds directly into quota-setting, territory design, and the hiring calendar. Think of it as the connective tissue between your revenue forecast and your people plan.
What CRM and HRIS data do you need before you model?
The quality of your capacity model is entirely determined by the quality of your inputs. A practical three-step approach starts with getting your CRM and HRIS data in order before you touch a single formula.
CRM fields to extract (Salesforce or HubSpot CRM)
- Closed-won bookings by month (minimum 12 months, ideally 24)
- Pipeline by stage, including opportunity creation date and close date
- Deal count and average deal size, segmented by product line and territory
- Sales cycle length (creation date to close date, by segment)
- Opportunity owner, so you can tie deals back to individual reps
- Product or segment tags, to separate SMB from mid-market from enterprise
HRIS fields to extract
- Rep start date and role or title (to calculate time-to-ramp from a consistent “time zero”)
- On-target earnings (OTE) and base/variable split
- Manager and team assignment
- Status changes: promotions, transfers, performance plans
- Termination dates and reason codes (voluntary vs. involuntary attrition)
- Location or territory assignment
Data quality checks before you model
Run these before building anything:
- De-duplicate opportunities, particularly where deals have been cloned or re-opened
- Remove outliers: a single £500,000 deal in a team that averages £40,000 will distort your average deal size significantly
- Normalise currencies if you have multi-currency CRM records
- Segment by product and vertical: a rep selling your enterprise product has a completely different productivity profile from one selling SMB
- Check for systematic under-recording: if your CRM shows fewer than two activities logged per closed deal, your pipeline data is probably incomplete
For early-stage businesses with fewer than 12 months of closed-won data, be explicit about the uncertainty. Use industry benchmarks as a starting point (see the assumptions section below), but flag them clearly in your model so stakeholders know which numbers are observed versus assumed.
What assumption drivers does your model need?
Every capacity model runs on a set of assumption drivers. Getting these right is more important than the formula itself, because ramp, attrition, and hiring lag are the most sensitive inputs and optimistic assumptions on any of them will produce a dangerously understated headcount requirement.
Here are the eight drivers to define before you build:
-
Ramp time: the number of months from hire date until a rep reaches full quota productivity. Benchmark ranges by segment are 2–3 months for SMB, 4–6 months for mid-market, and 6–9 months for enterprise. Use your own data wherever possible by aligning all hires to a “time zero” start date and plotting their monthly bookings as a percentage of quota.
-
Quota attainment: the percentage of quota your reps actually achieve, not the percentage you hope for. Pull this from your CRM at the individual rep level, exclude reps who left in their first 90 days, and calculate the median rather than the mean (the mean is skewed by your top performers).
-
Effective bookings per rep: quota × attainment. This is the number that actually flows into your revenue forecast. A rep on a £200,000 quota who attains 80% contributes £160,000 in expected bookings.
-
Bookings-to-OTE ratio: the ratio of expected bookings per rep to their OTE. A healthy ratio for most UK B2B SaaS businesses sits between 4:1 and 6:1. If your ratio is below 3:1, you have a productivity or pricing problem that hiring will not fix.
-
Selling time percentage: the proportion of a rep’s working week spent on revenue-generating activity. Admin, internal meetings, and CRM hygiene tasks eat into this. Track it honestly; many teams find it is closer to 35–40% than the 60% they assume.
-
Attrition rate: voluntary and involuntary combined, annualised. If you lose 20% of your team each year, you need to hire not just for growth but to replace departures. Model this as a monthly probability so you can see its compounding effect.
-
Time-to-fill: the number of weeks from opening a requisition to a rep’s first day. Include offer-acceptance rate and notice period. UK mid-market sales roles typically take several weeks to start after requisition.
-
Pipeline coverage target: the multiple of your bookings target that you need in qualified pipeline to feel confident in the forecast. A 3× coverage ratio is a common starting point, but this varies by sales cycle length and stage-conversion rates.
Segment every driver by role, product line, and territory. Treating all reps as identical is one of the most common and costly mistakes in capacity modelling.
How do you build a monthly, time-phased capacity model?
The model has three tabs in Excel or Google Sheets. A spreadsheet with roster, assumptions, and outputs tabs is the most accessible starting point for most UK B2B teams before investing in dedicated planning software.
Tab structure
Roster tab: one row per seat, with columns for rep name (or “TBH” for planned hires), start date, role, segment, OTE, ramp stage by month, and monthly bookings contribution.
Assumptions tab: a single source of truth for all drivers. Every formula in the roster and outputs tabs should reference this tab, never hard-coded values. This is what makes scenario testing fast.
Outputs tab: monthly and quarterly summaries of ramped FTE, total expected bookings, gap to target, and cumulative cost.
Core formulas
Per-seat monthly contribution:
= Quota × Attainment % × Ramp % for that month
For a rep in month 3 of a 6-month ramp, if your ramp curve assigns 50% productivity at month 3, the formula is: £200,000 ÷ 12 × 0.80 × 0.50 = £6,667 for that month.
Team capacity for a given month:
= SUM of all per-seat monthly contributions
Gap to target:
= Monthly bookings target − Team capacity
A positive gap means you need more capacity. A negative gap means you are over-resourced for that period.
Modelling ramp as a monthly curve
Do not use a binary “ramped / not ramped” switch. Instead, assign a ramp percentage to each month post-hire. A typical mid-market curve might look like: month 1 = 0%, month 2 = 25%, month 3 = 50%, month 4 = 75%, month 5 = 100%. Apply this as a lookup against each rep’s months-since-hire value.
Scenario testing
Build three attainment scenarios directly into your assumptions tab:
Run a time-to-fill sensitivity alongside these: what happens if recruiting takes 4 weeks longer than planned? In most models, a 4-week slip in hiring start date costs you one full month of ramp contribution, which compounds across the quarter.
Pro Tip: Lock your assumptions tab with a password and require a change-log entry for every update. Capacity models that drift silently are far more dangerous than ones with known gaps.
Two worked examples: SaaS and professional services
SaaS example
Inputs:
- Annual ARR target: £3,000,000
- Quota per rep: £300,000
- Historical attainment: 78%
- Ramp curve with steadily increasing productivity over several months, reaching full productivity after around five months.
- Annual attrition: 20% (approx. 1 rep lost per quarter on a 20-rep team)
- Time-to-fill: 10 weeks
Calculation:
Effective annual contribution per fully ramped rep is calculated as the product of quota and attainment.
Reps needed at full ramp = £3,000,000 ÷ £234,000 = 12.8, so 13 fully ramped reps.
Accounting for 20% attrition, you need to carry approximately 15–16 seats to maintain 13 productive contributors.
With a 5-month ramp and a 10-week time-to-fill, any hire needed by Q3 must be requisitioned by the start of Q1.
Output: 16 seats, with 4 requisitions opening in January, 2 in March, and the remainder in May.
Professional services example
Inputs:
- Annual bookings target: £1,800,000
- Quota per rep: £180,000
- Historical attainment: 70%
- Ramp curve with steadily increasing productivity over several months, reaching full productivity after around six months, reflecting longer ramp times for complex sales.
- Annual attrition: 15%
- Time-to-fill: 14 weeks (specialist roles take longer to fill)
Calculation:
Effective annual contribution per fully ramped rep is calculated as the product of quota and attainment.
Reps needed at full ramp = £1,800,000 ÷ £126,000 = 14.3, so 15 fully ramped reps.
With 15% attrition and a 6-month ramp, you need 17 seats and must open requisitions 10 months before the period you need capacity.
Output: 17 seats, with the first requisitions opening in February for a Q4 capacity need.
Why the two examples diverge
| Input | SaaS | Professional services |
|---|---|---|
| Quota per rep | £300,000 | £180,000 |
| Attainment | 78% | 70% |
| Ramp duration | 5 months | 6 months |
| Attrition | 20% | 15% |
| Seats required | 16 | 17 |
| Lead time for hiring | 6–7 months | 10 months |
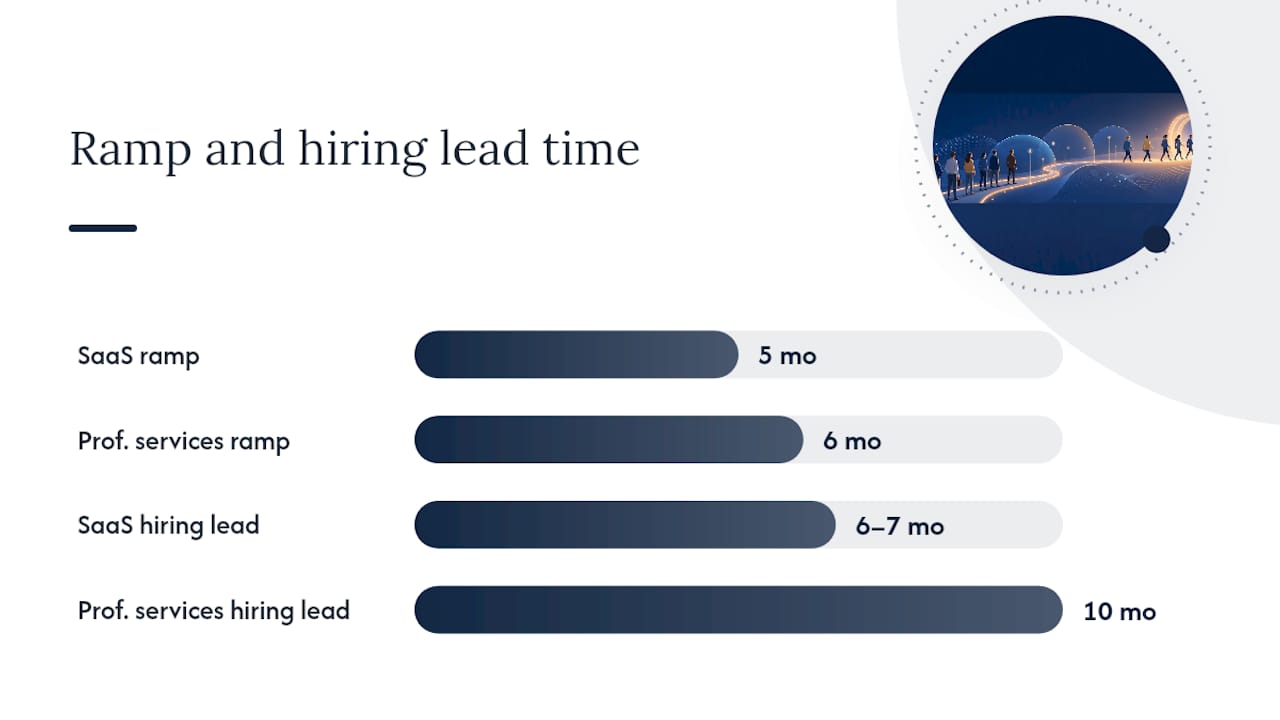
The professional services model needs more lead time despite a lower attrition rate, because the longer ramp and lower attainment compress the effective contribution per seat. The single biggest lever in both models is attainment: a 10-percentage-point improvement in attainment reduces headcount requirement by roughly 1–2 seats in each example.
How do you turn model outputs into a hiring plan?
The capacity model tells you how many seats you need. The hiring plan tells you when to open each requisition. Work backwards from the date you need a rep to be fully productive:
- Need date: the month you need full contribution
- Minus ramp duration: e.g. 5 months for mid-market SaaS
- Minus time-to-fill: e.g. 10 weeks (approximately 2.5 months)
- = Requisition open date: typically 7–8 months before the need date
For a rep you need fully productive in October, you should open the requisition in February or March at the latest.
Basic cost economics
For each planned hire, calculate the fully loaded first-year cost:
- OTE: base + on-target commission (e.g. £70,000 base + £30,000 variable = £100,000 OTE)
- Employer’s National Insurance and pension: approximately 15% on top of OTE in the UK
- Hiring cost: agency fee (typically 15–20% of base salary) or internal recruiter allocation
- Onboarding and enablement: technology licences, training programmes, manager time
A simple break-even formula: Break-even month = Fully loaded first-year cost ÷ Monthly expected bookings contribution. For a rep with a £100,000 OTE, £15,000 in employer costs, and a £10,000 hiring fee (total £125,000), contributing £15,600 per month at full ramp (£234,000 ÷ 12 × 0.80), break-even arrives at approximately month 8 of productive selling, or month 13 from hire date when ramp is included.
Bain’s research makes a compelling case for examining productivity levers before opening new requisitions. Raising attainment by 10 percentage points across an existing team of 15 reps can deliver the same incremental bookings as 1–2 new hires, at a fraction of the cost and with no ramp delay. Sales acceleration packages and targeted coaching are often faster routes to capacity than hiring.
If your model says 16 seats, plan to carry 17–18 and treat the buffer as insurance, not growth.
Common pitfalls and how to validate your model
Even a well-structured model can produce dangerously optimistic outputs if the inputs are wrong. Top-down and bottom-up models serve different purposes, and mature teams run both, then reconcile the gap to surface hiring, territory, or quota issues.
Top pitfalls:
- Using quota instead of attainment: quota is a target, not a forecast. Always model on historical attainment.
- Ignoring ramp and attrition: a model that counts every seat as 100% productive from day one will understate your headcount need by 30–50% in a growing team.
- Treating all reps as equal: a rep in month 2 of their tenure is not the same as a rep in year 3. Segment your roster.
- Poor CRM hygiene: if closed-won bookings are inconsistently recorded (wrong close dates, missing deal values, duplicate opportunities), your attainment and average deal size figures are unreliable.
- Not segmenting by product or market: an SMB rep and an enterprise rep have fundamentally different productivity profiles. Mixing them produces an average that describes neither.
Validation checklist:
- Reconcile your model’s expected bookings to your pipeline coverage ratio. If your model expects £3,000,000 and your pipeline shows £6,000,000 at 3× coverage, the numbers are consistent. If pipeline is only £4,500,000, you have a coverage gap.
- Run all three attainment scenarios (80% / 100% / 120%) and check that the outputs are plausible.
- Compare your bottom-up roster model to a simple top-down check (target ÷ average productivity per rep). If they diverge by more than 15%, investigate why.
- Sanity-check against recruiting capacity: can your talent team actually fill that many roles in the timeframe?
Governance:
- Review the model monthly, not just at annual planning. Quarterly rolling models with monthly updates capture hiring timing and attrition movement far more accurately than annual-only plans.
- Assign named owners for each assumption category: sales leadership owns attainment and quota, FP&A owns the revenue target, recruiting owns time-to-fill.
- Maintain a version-controlled change log. Every time an assumption changes, record who changed it, when, and why.
Pro Tip: Add a “sanity check” metric to your outputs tab: implied bookings per available selling hour. If your model requires each rep to generate £180 per selling hour to hit target, and your current team averages £110, you have a productivity gap that headcount alone will not close.
Practitioner checklist for operationalising your capacity model
Moving from a model in a spreadsheet to a live operational plan requires a structured sequence. Here is the playbook:
-
Data preparation: extract CRM and HRIS fields as listed above. Clean, de-duplicate, and segment before touching the model. Assign a data owner who signs off on the extract.
-
Model build: construct the three-tab spreadsheet (roster, assumptions, outputs). Populate the roster with current headcount and all confirmed hires. Lock the assumptions tab.
-
Scenario planning: run conservative (80%), base (100%), and optimistic (120%) attainment scenarios. Add a time-to-fill sensitivity (base + 4 weeks). Present all four outputs to leadership.
-
Hiring calendar: convert the outputs tab into a requisition schedule. For each planned hire, record the requisition open date, target start date, and hiring manager. Share with recruiting.
-
Territory and quota design: use the model outputs to validate that quota assignments are achievable given the rep mix. A territory with one ramping rep and a £500,000 quota is almost certainly set to miss. Sales team optimisation guidance can help you redesign territories before the plan is locked.
-
Quota handoff: once territories are confirmed, hold a formal quota handoff meeting between sales leadership and each rep. Document acceptance and any agreed adjustments.
-
Enablement and coaching interventions: before opening every requisition, ask whether a coaching or training intervention could close the capacity gap instead. Improving sales performance through targeted enablement is consistently faster and cheaper than hiring when the gap is under 15% of target. AI-assisted tools and automation can also lift pipeline throughput without adding headcount, as AI productivity case studies increasingly demonstrate.
-
Governance cadence: hold a monthly 30-minute model review between sales ops, FP&A, and recruiting. Review actuals versus model, update assumptions where needed, and flag any hiring slippage.
A gap of that size requires a strategic decision, not a spreadsheet adjustment.
How to use your capacity planning template effectively
Once your three-tab spreadsheet is built, the fastest way to get value from it is to run three starter scenarios before presenting anything to the board.
Pasting in your data:
- Paste your CRM closed-won extract into the roster tab, one row per rep, with their actual start date and monthly bookings history
- Paste your HRIS extract alongside it: OTE, role, territory, and termination dates for leavers
- Populate the assumptions tab with your calculated drivers (ramp curve, attainment, attrition, time-to-fill)
Three starter scenarios to run first:
- Conservative (80% attainment): this is your downside. If the model shows a large gap here, you have a structural capacity problem that needs immediate action.
- Base (100% attainment): your planning baseline. This is what you present as the primary forecast.
- Optimistic (120% attainment): useful for showing the upside if your top performers replicate their results across the team.
Add a fourth scenario: base attainment with a 4-week hiring delay on every planned requisition. This is often the most instructive, because it shows how sensitive your Q3 and Q4 targets are to a slow February recruiting cycle.
Board-ready outputs to export:
- Hires by month (a simple bar chart from the outputs tab)
- Expected fully ramped FTE equivalents by quarter (line chart against target)
- Cumulative cost versus expected bookings return (a two-line chart showing break-even)
When to move beyond Excel or Google Sheets: a spreadsheet works well for teams up to roughly 30–40 reps. Above that, the roster tab becomes unwieldy, version control gets difficult, and scenario testing slows down. At that point, dedicated revenue operations planning tools become worth the investment. For most UK B2B teams at Series B or below, a well-structured spreadsheet remains the most practical starting point.
When should you run a full model versus a quick check?
Not every hiring decision needs a 12-tab spreadsheet. The right level of modelling depends on the stakes and the data you have available.
A lightweight top-down check is sufficient when:
- You are making a single tactical hire mid-year
- Your team is small (fewer than 8 reps) and your data history is under 12 months
- The growth target is under 15% and your current team is performing close to quota
The calculation is simple: target ÷ average productivity per rep = reps needed. If you have 8 reps averaging £180,000 in bookings each and your target is £1,800,000, you are exactly at capacity. One departure or one underperformer changes that immediately, which is why even a lightweight check should include an attrition buffer.
A full, time-phased bottom-up model is necessary when:
- You are presenting to a board or raising a funding round that includes a headcount plan
- You are launching a new territory, product line, or rep profile with different ramp assumptions
- Your hiring programme involves more than 3 new seats in a single quarter
- Your current attainment is below 80% and you need to understand whether the gap is a capacity problem or a productivity problem
The trade-off is speed versus accuracy. A top-down check takes 20 minutes and gives you a directional answer. A full model takes 2–3 days to build properly but gives you a defensible, month-by-month plan that finance and the board can interrogate. For most UK B2B firms at growth stage, the full model pays for itself the first time it prevents an over-hire or catches a Q3 capacity gap in January rather than July.
How Aheadofsales helps you move from model to results
Building the model is the analytical half of the job. The harder half is turning the outputs into rep behaviour, coaching interventions, and a hiring plan that actually delivers the bookings you projected.
Aheadofsales works with UK B2B sales leaders and FP&A teams to do exactly that. Through bespoke capacity modelling workshops, fractional sales director support, and targeted coaching programmes, the team helps you validate your assumptions, close attainment gaps before you open requisitions, and build the governance cadence that keeps the model live rather than gathering dust after the planning cycle. Packages for growth-stage businesses start from £4,500, with sales training services available for teams of 5 to 500. If your capacity model is showing a gap, the first conversation is about whether coaching and enablement can close it before you commit to a hire. Book an exploratory call at Aheadofsales to get started.
Sources
The following sources informed this guide and are worth consulting directly for benchmarks, templates, and methodology:
- Sales Capacity Planning | Salesforce
- Sales capacity planning and modeling guide–with template — HiBob
- Sales Capacity Planning: The Complete Guide for Revenue Operations — The GTM Advisor Group
- Sales Capacity Planning | Formula + Calculator — Wall Street Prep